Traffic Monitor - Analyse live & historical data
Always understand what is going on in your system at any time via the traffic monitor - either using live or history mode.
"Why did the light turn on yesterday at 5PM? Oh it was by Mike via mobile app!"
🎬 Video tutorial
Learn how to monitor traffic in 1Home.
Table of contents
Select your monitor
You can select between two types of traffic monitors:
KNX Monitor- optimized to view KNX traffic, similar to ETS Diagnostics view.System Monitor- shows state changes of your devices, who requested the change (e.g. Mobile app) and can optionally also show KNX traffic.

How much data can be stored?
The duration of data that can be stored on your device depends on the amount of traffic that your device is seeing.
As an example, in a house of 150 square meters with around 100 1Home devices configured (1 device means one actual light, shutter, sensor, ...), we are able to keep for a bit more than 1 year of traffic history for both KNX, system and usage in graphs.
KNX Traffic Monitor
View live KNX traffic
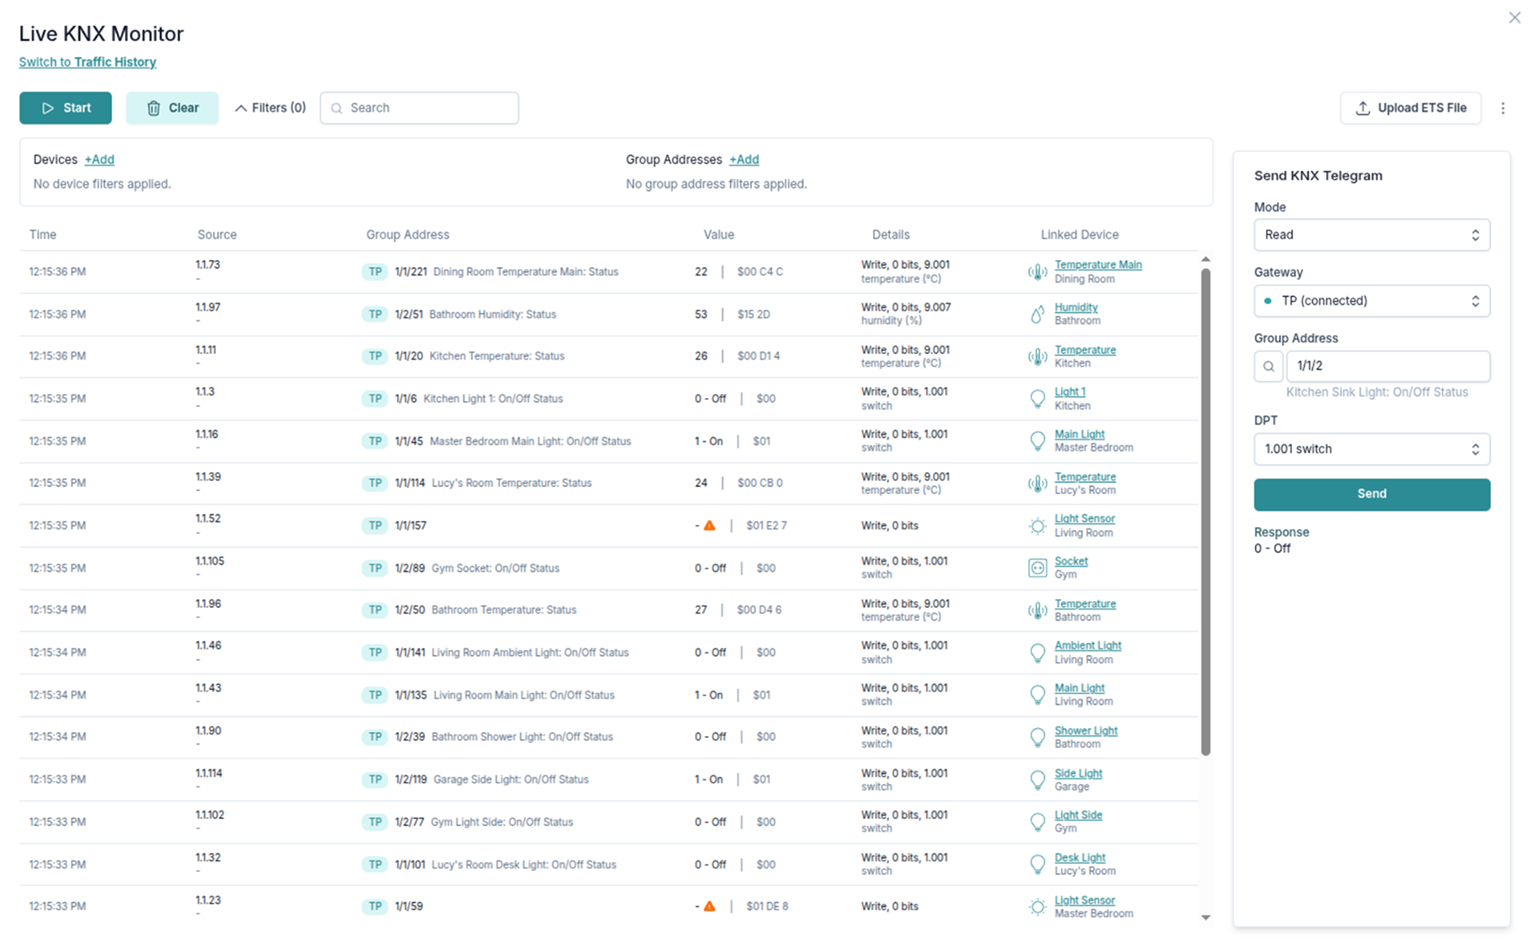
In Live mode of KNX traffic monitor, you can see all KNX telegrams that your 1Home device can see.
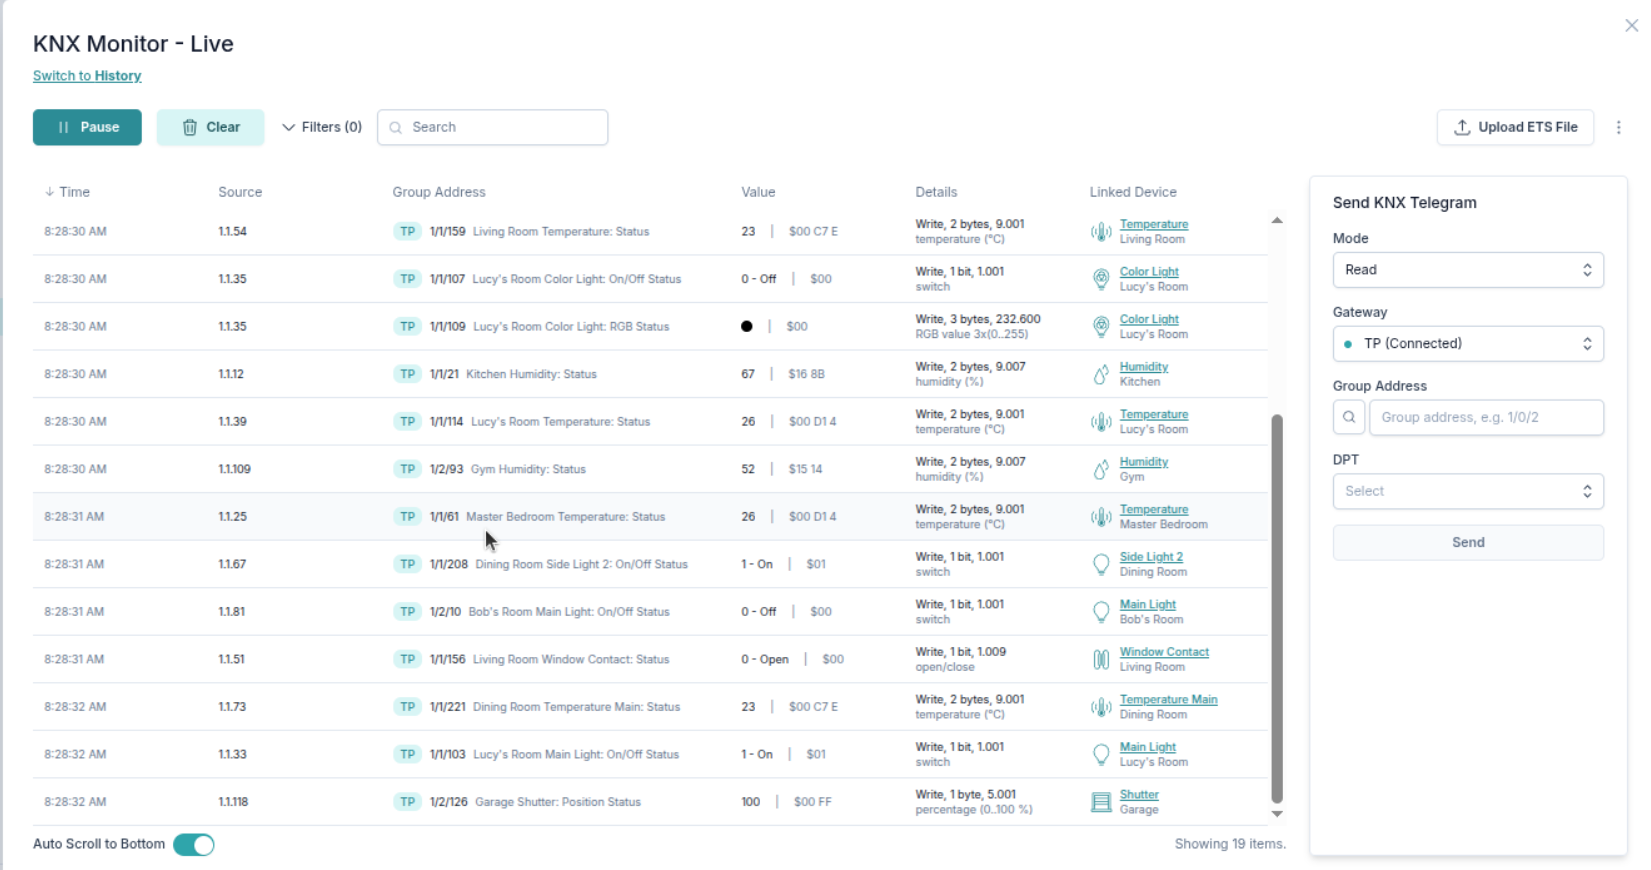
View KNX telegrams live
Directly Read/Write KNX group addresses
You can also Read and Write KNX telegrams to the KNX bus directly from this view.
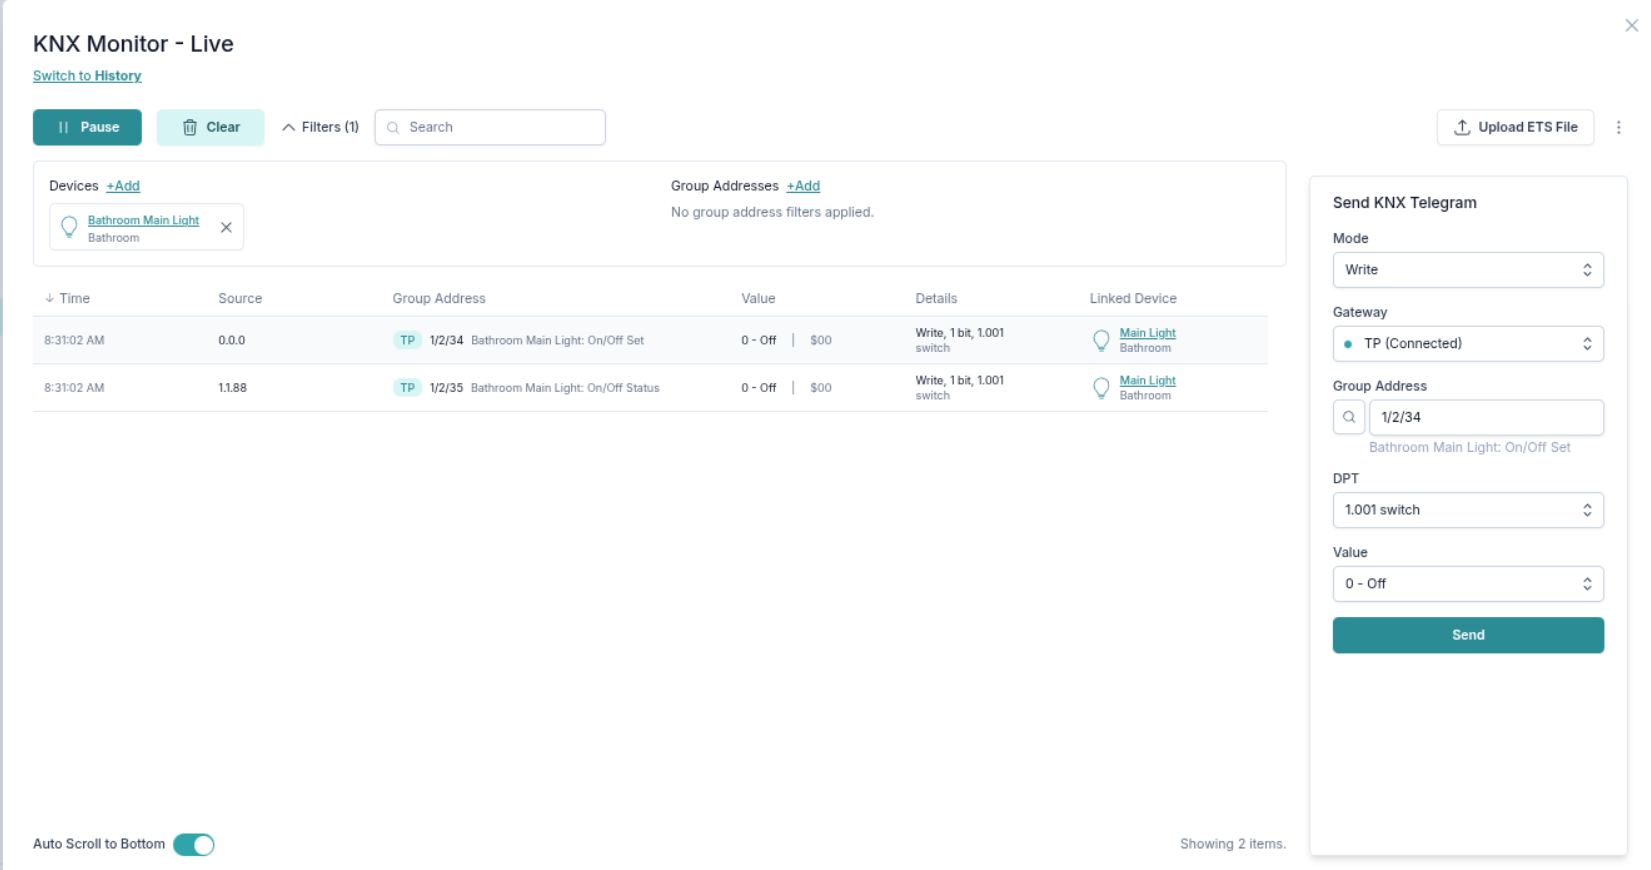
Writing a group address 1/2/34. See how we get a status response back from KNX.
Filter by device or group addresses
For easier overview of the data, you can use filtering.
Use either Search or Filters where you can select a specific group address or all group addresses linked to a device configured in 1Home.
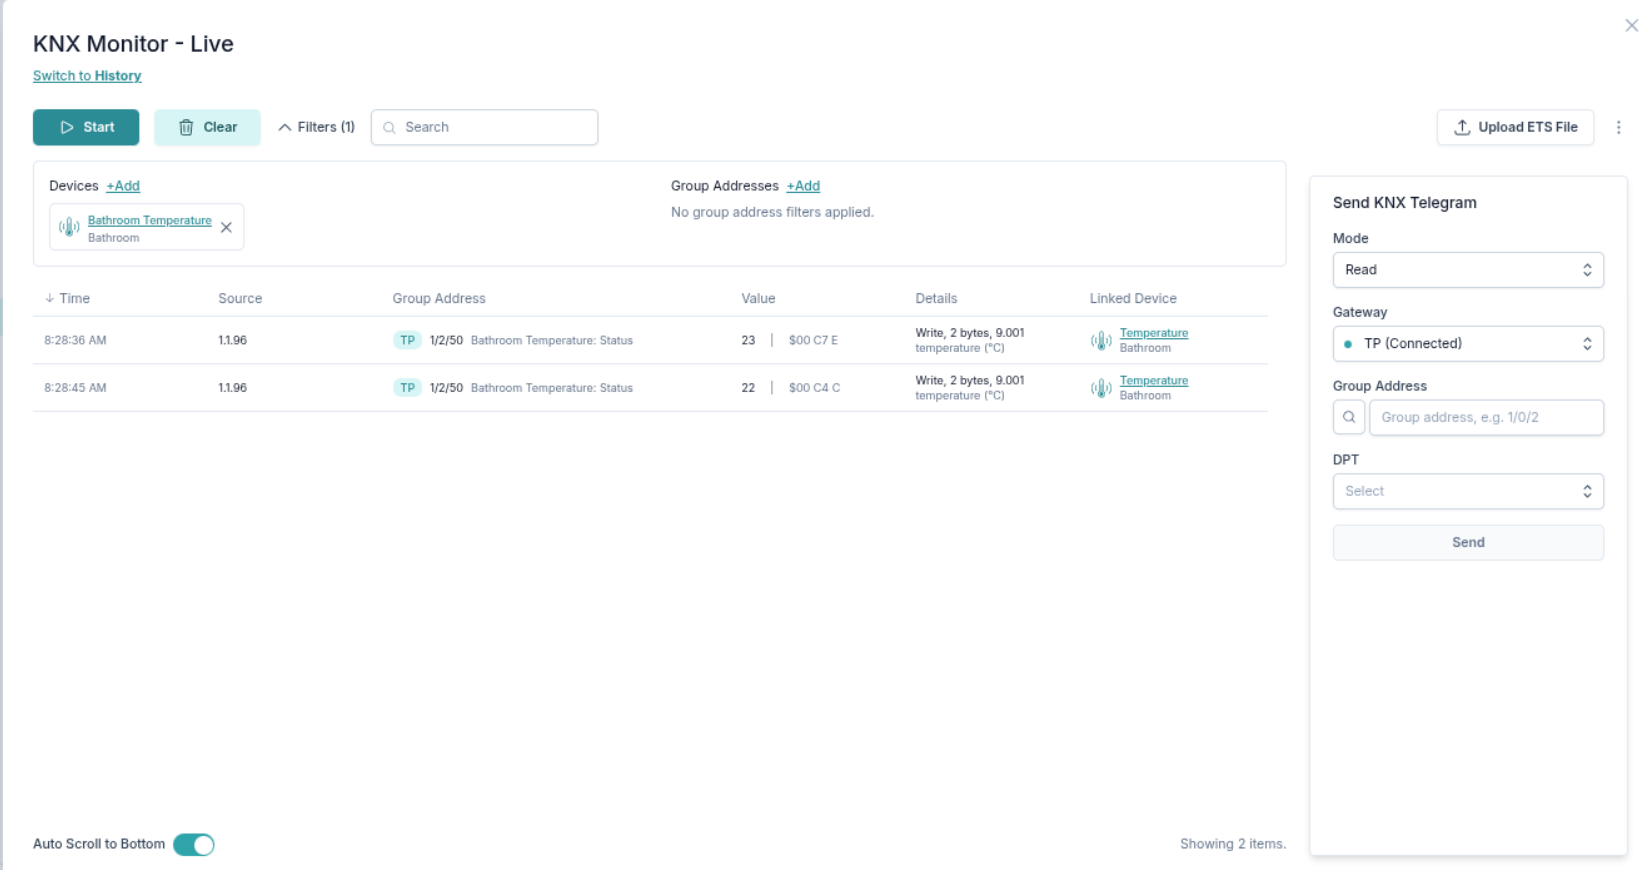
The view is filtered by device.
View KNX traffic history
You can also select a time-range to view the history of the KNX traffic. 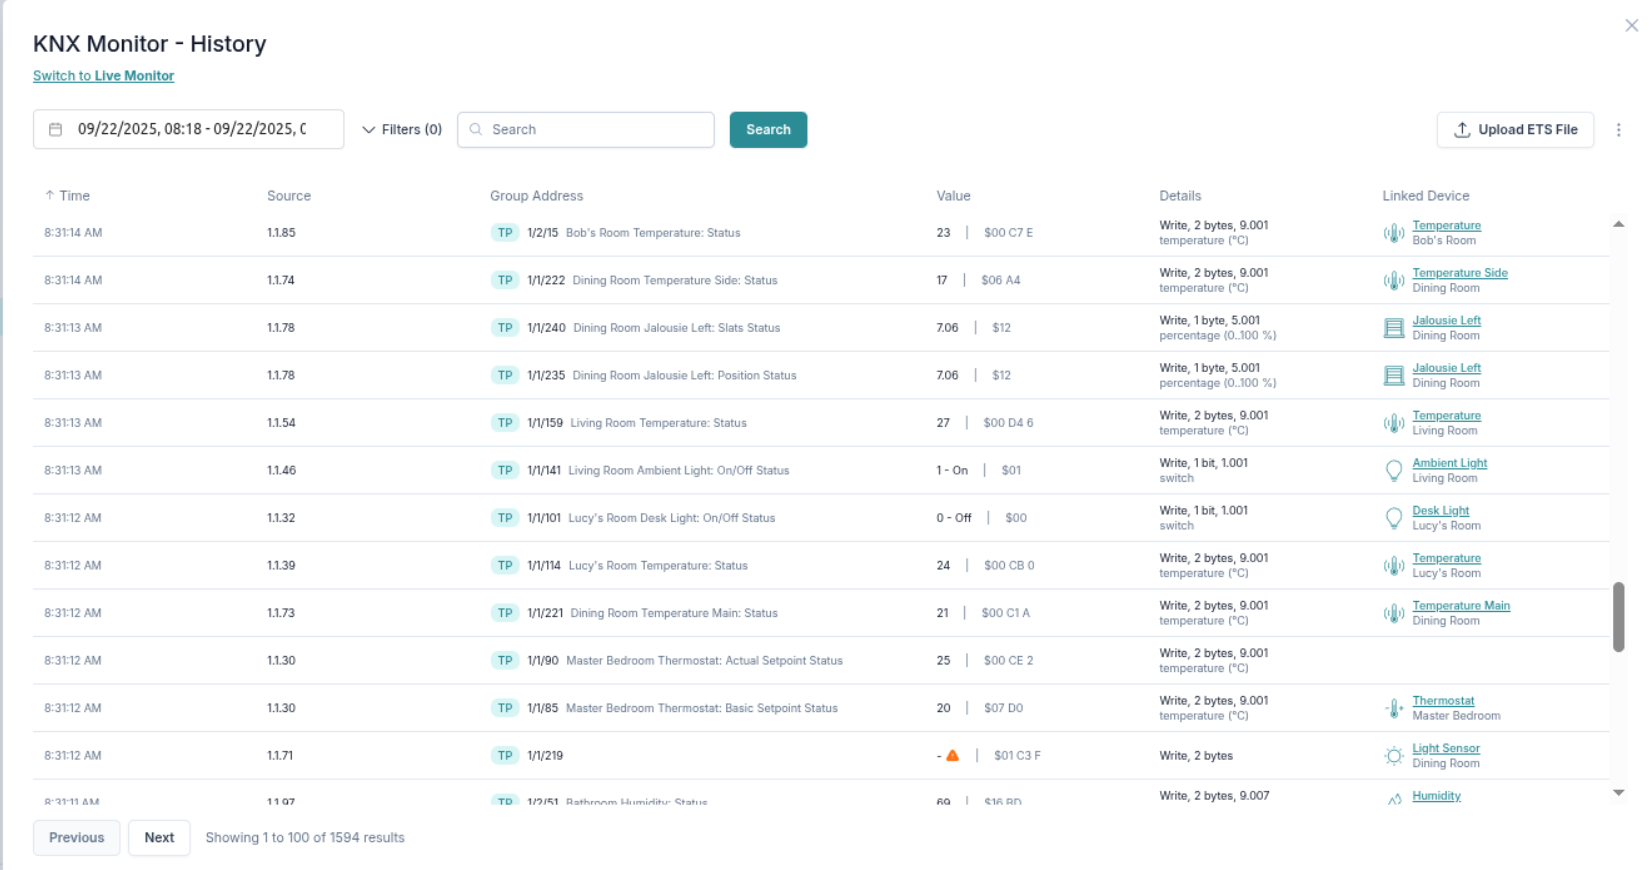
System Traffic Monitor
Follow your device changes live
You can see how the device states change through time.
You can also see why a certain change happened (toggle Show Change Requests filter). Some reasons might be:
- A device from KNX sent a KNX telegram
- A user action from the mobile app
- Caused by an automation
- Request came from a Matter compatible app
- etc.
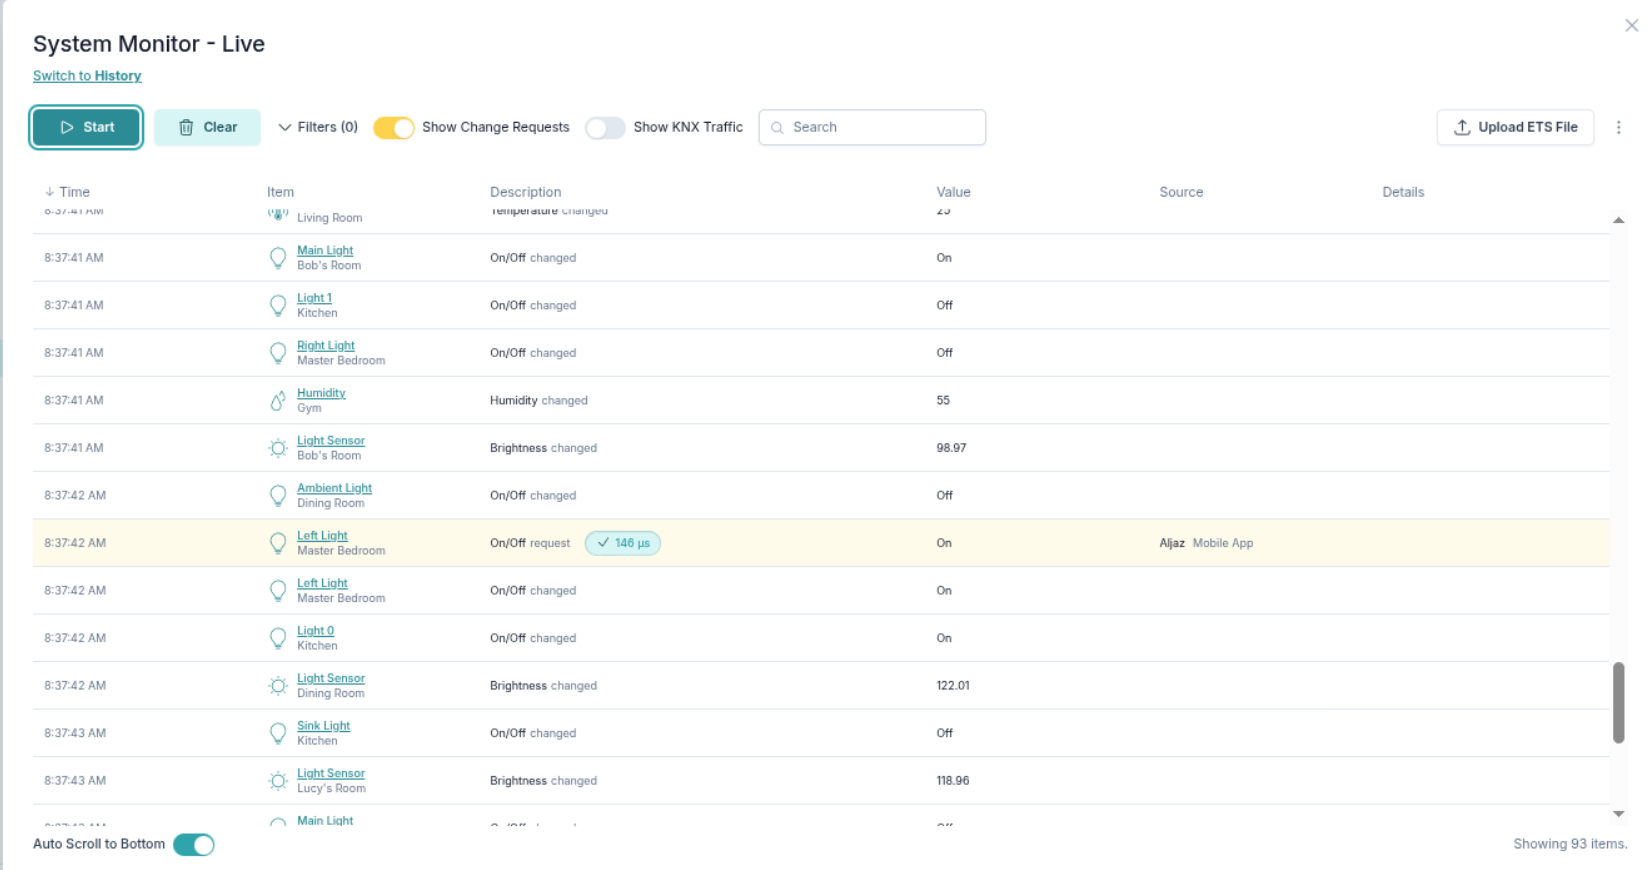
View live system traffic
You can always see the KNX changes alongside the system traffic. 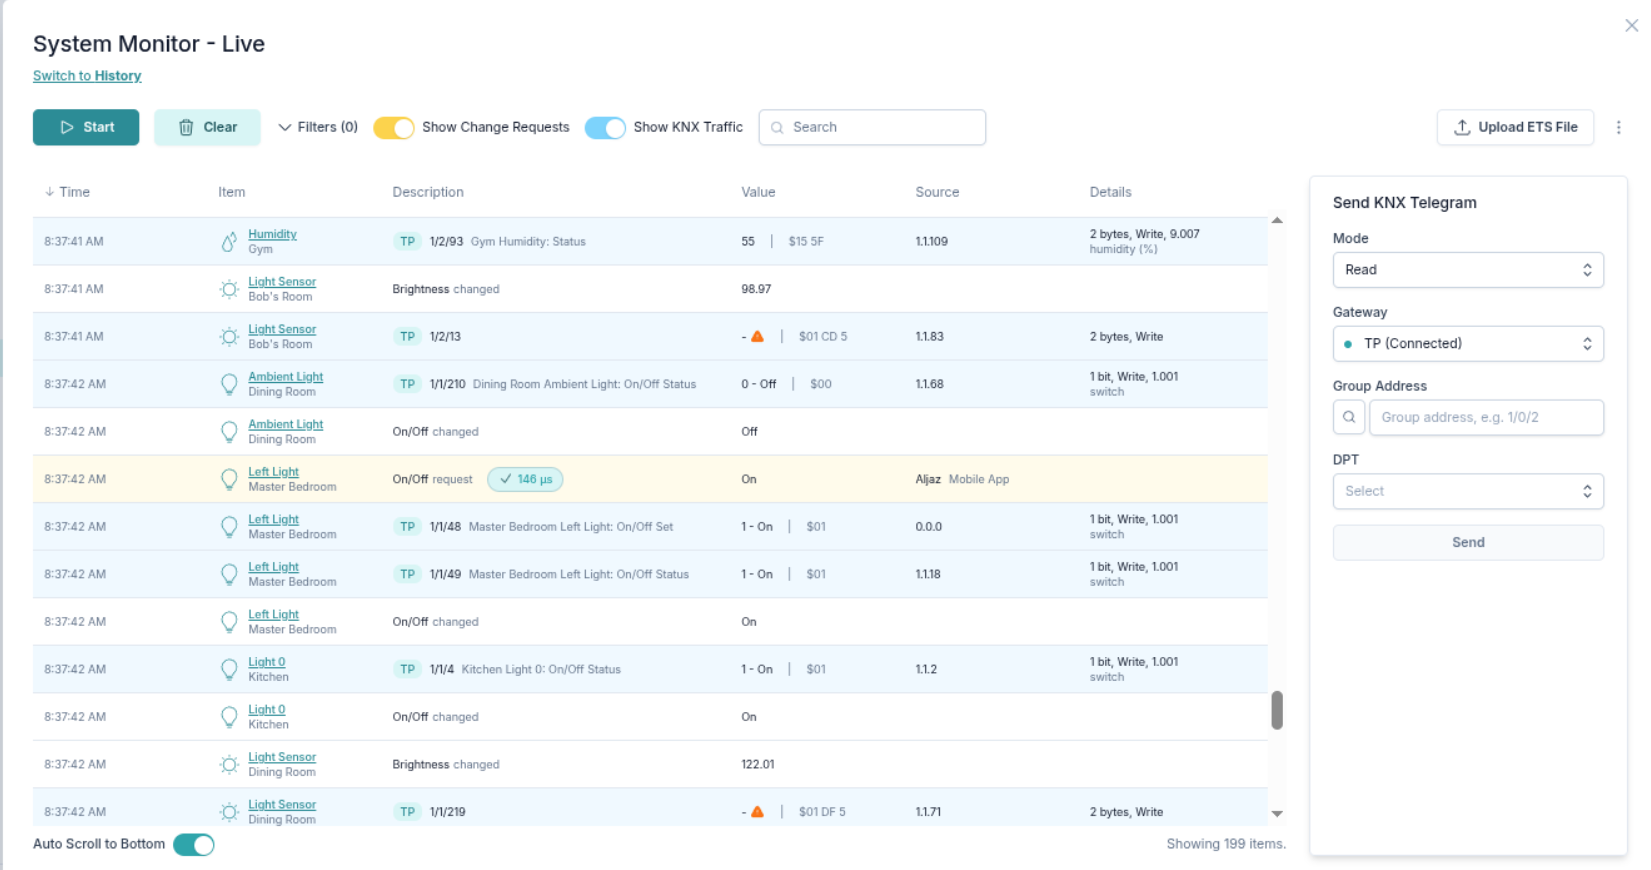
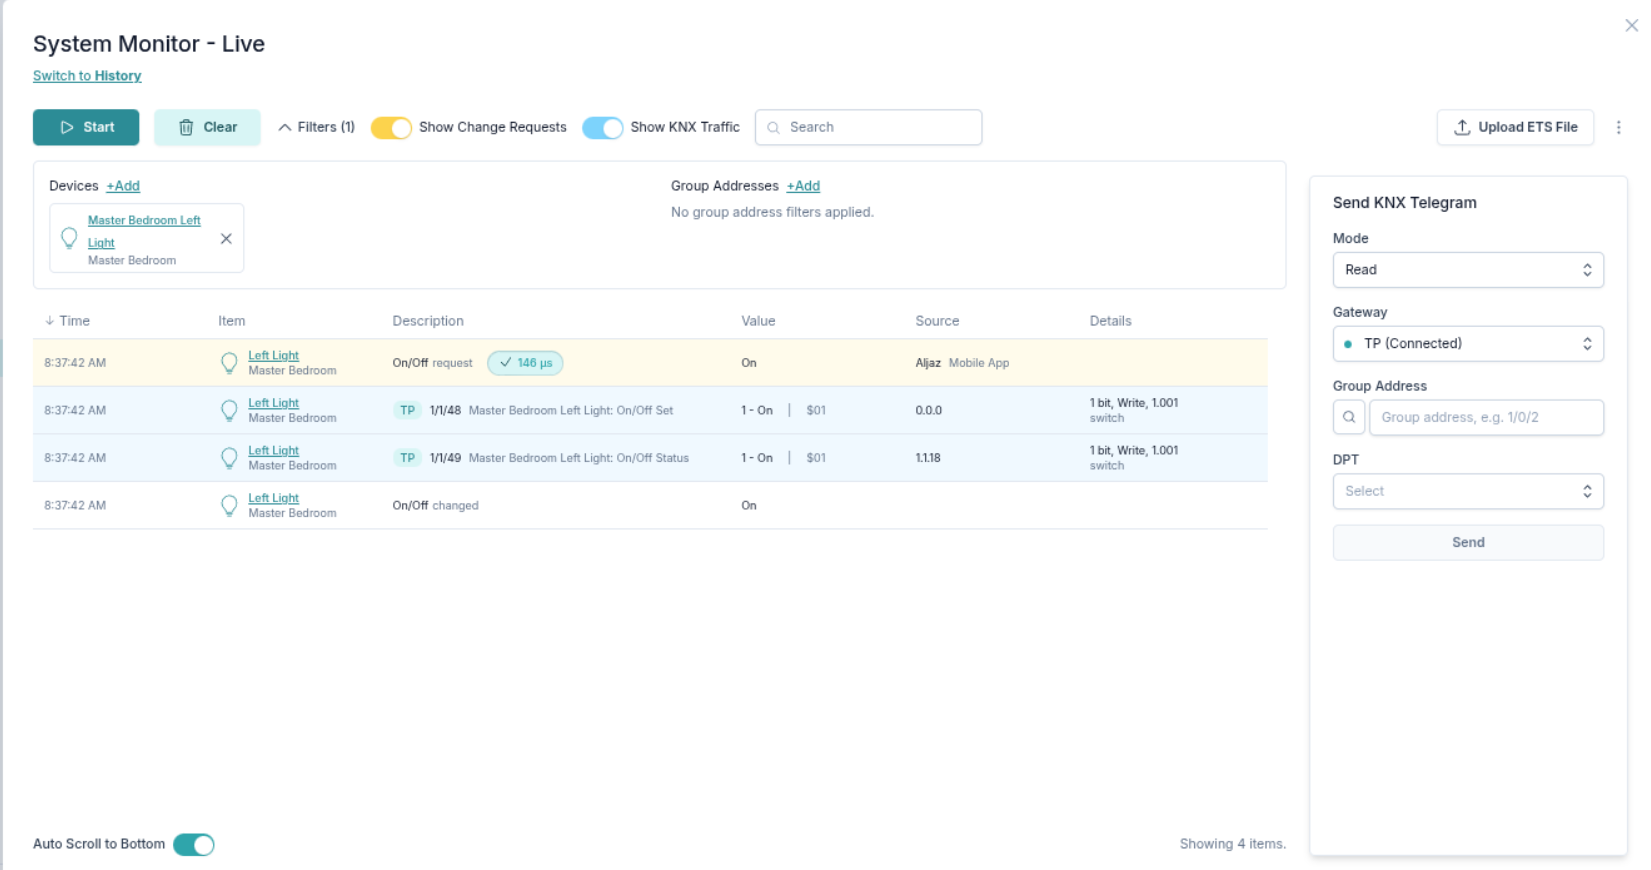
Viewing system and KNX traffic for a specific device with all group addresses linked to this device.
Filter your system traffic
As with KNX traffic, you can filter the result by device or group address.
Analyse device changes through history
Besides the live mode you can also see the history of the system traffic.