Graphs
Visualize your smart home data with graphs.
Create custom graphs or view the ones that 1Home automatically generates for you.
Table of contents
🎬 Video tutorial
Learn how to use graphs in 1Home.
How far back in time will I be able to see graphs?
The duration of data that can be stored on your device depends on the amount of traffic that your device is seeing.
As an example, in a house of 150 square meters with around 100 1Home devices configured (1 device means one actual light, shutter, sensor, ...), we are able to keep for a bit more than 1 year of traffic history for both KNX, system and usage in graphs.
Types of graphs
You can create graphs that include any number of the following items:
Device attributes- for example thermostat setpoint, mode, light brightness, humidity etc.KNX Group Address Values- select a DPT and display it on the graph
View graphs for each device
Devices that you configure in 1Home already come with automatically generated graphs.
You can access them under Devices tab by clicking on Configure next to the device and on History.
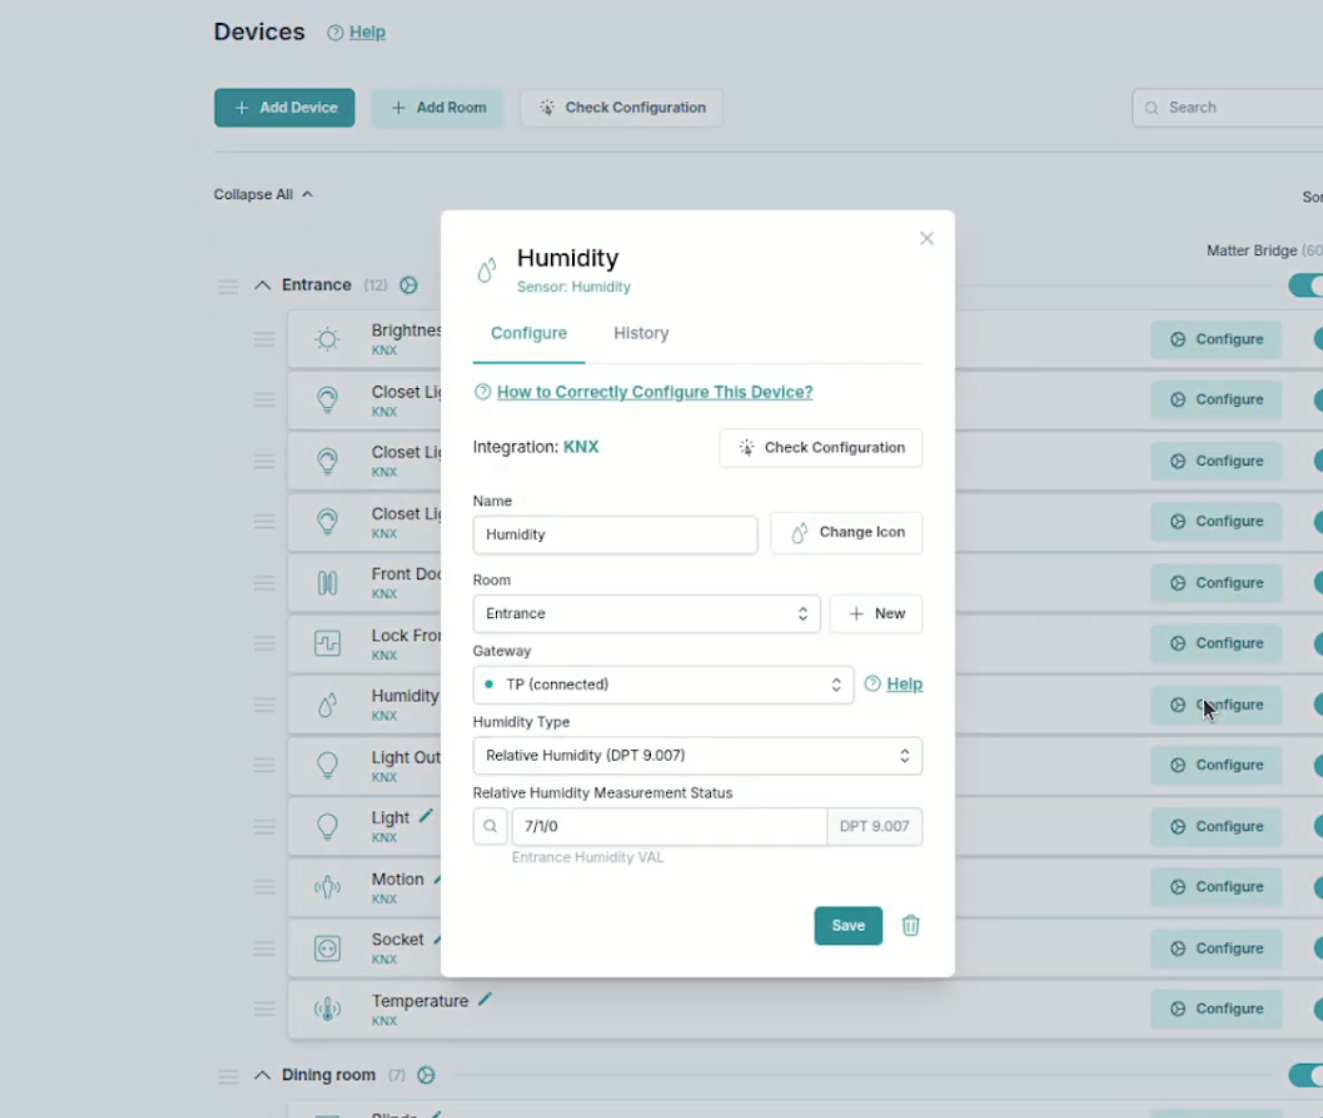
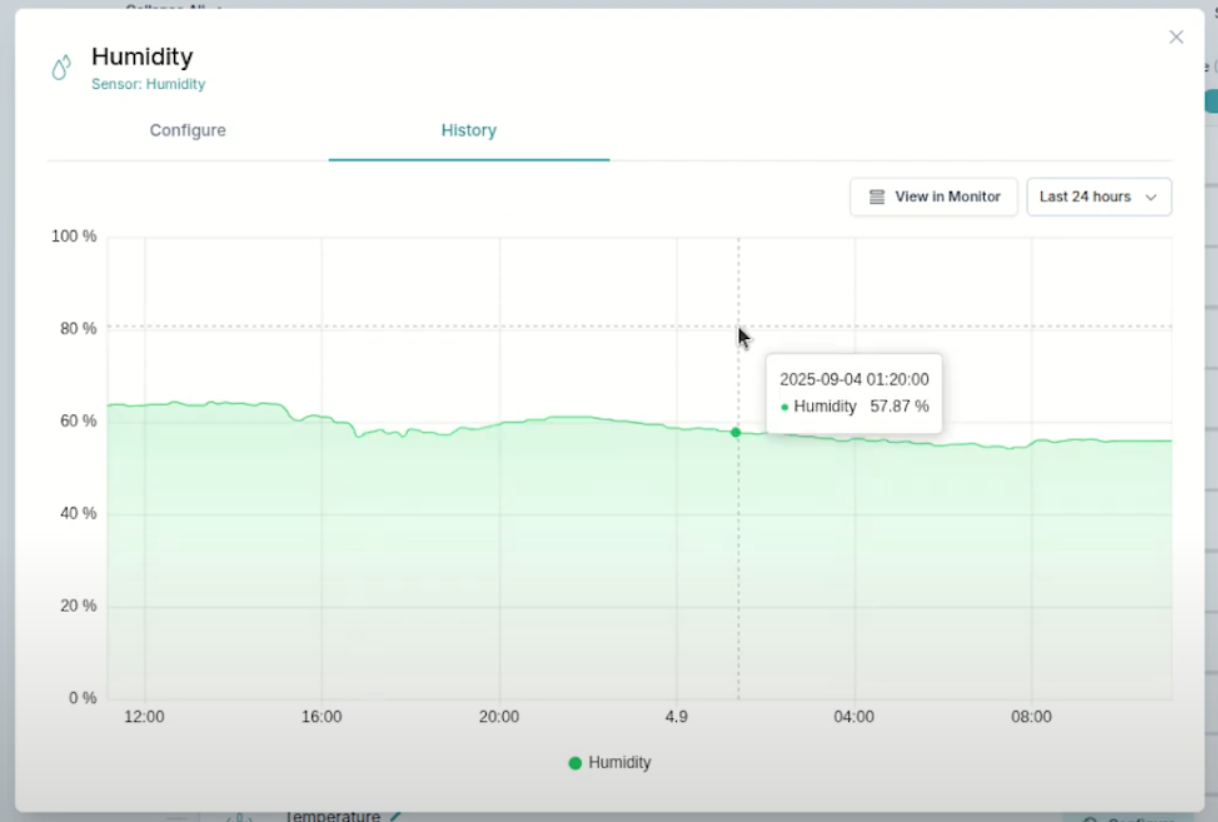
You can also access the history of this device in the Traffic Monitor by clicking the
View in Monitorbutton.
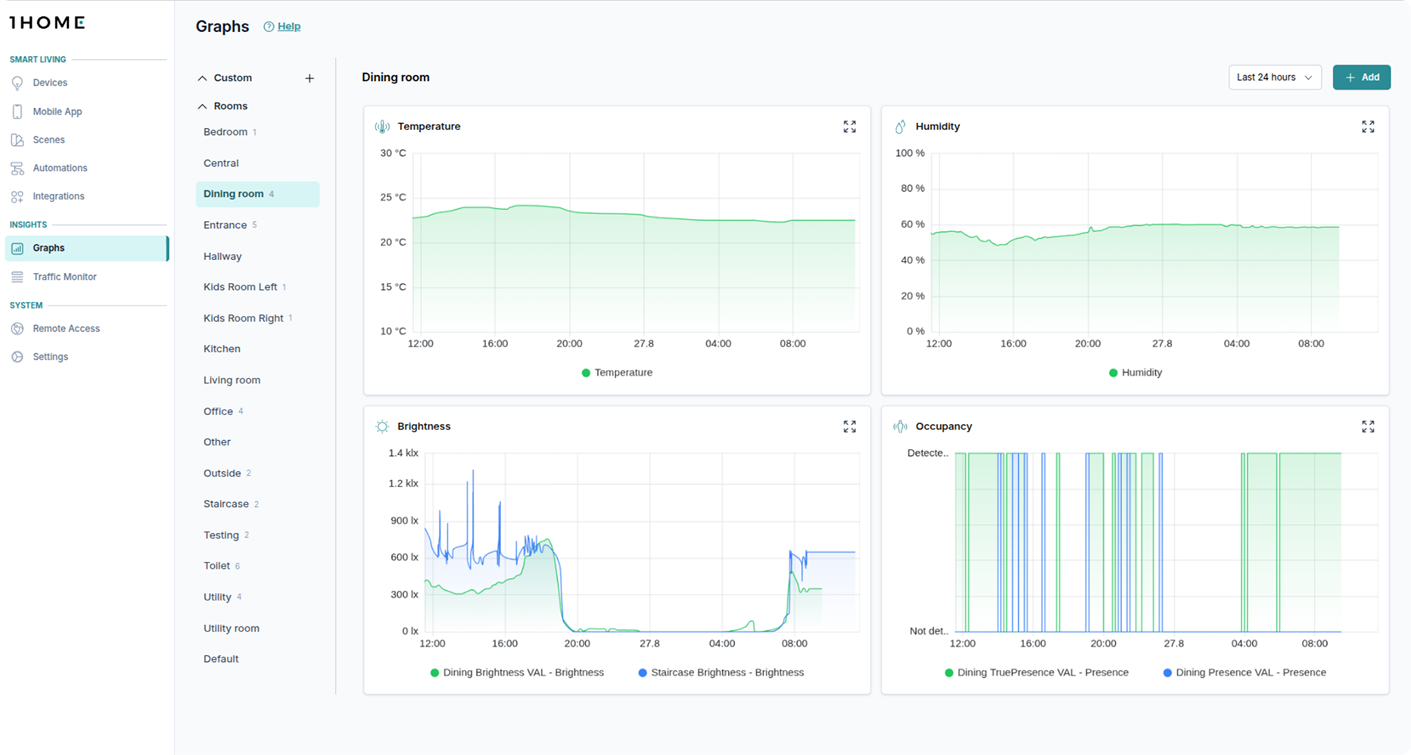
View graphs for different rooms
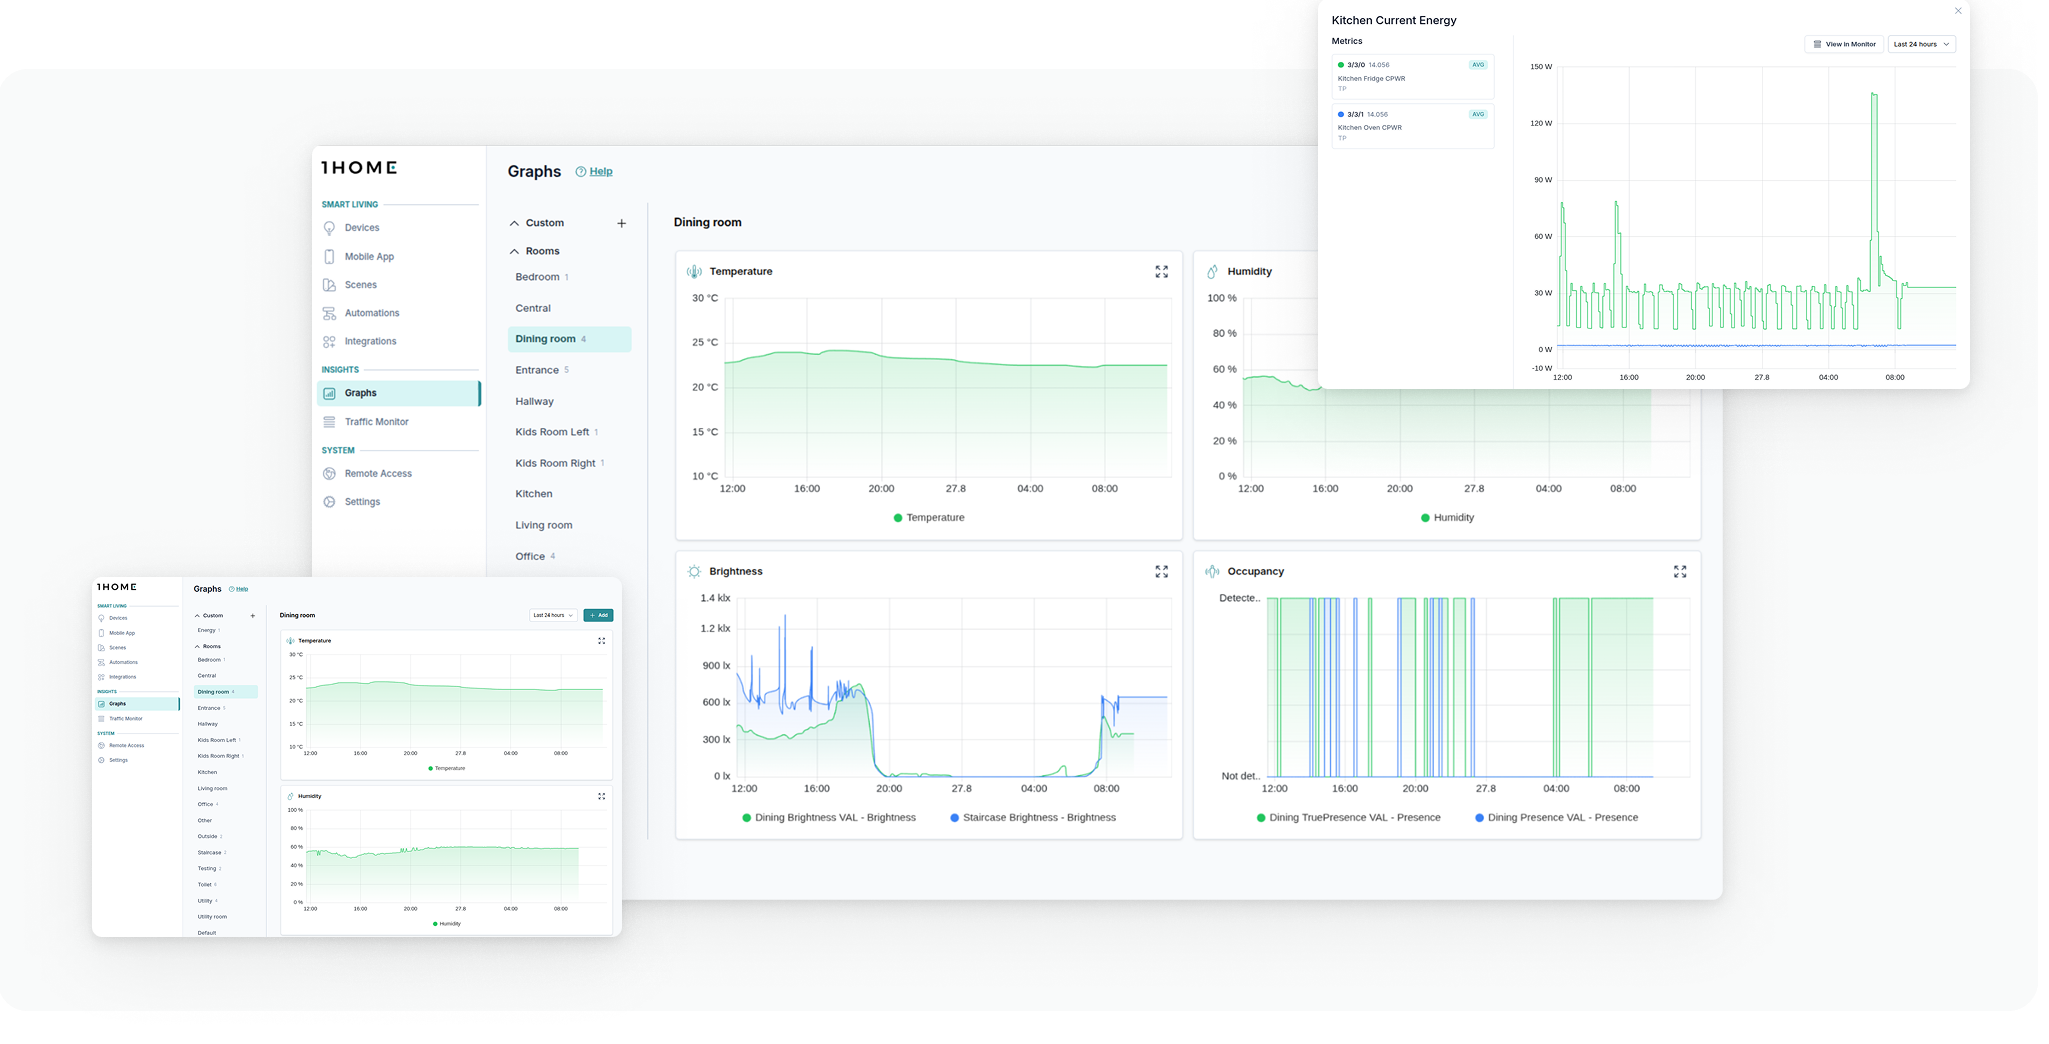
Some graphs are automatically populated for each room. This includes temperature, humidity, brightness, occupancy and contact sensor graphs. This way you can see all temperature sensors in the same room in one graph with zero extra clicks.
Create custom graphs
You can add custom graphs in rooms or in custom views.
See an example of the custom graph displaying energy consumption below. 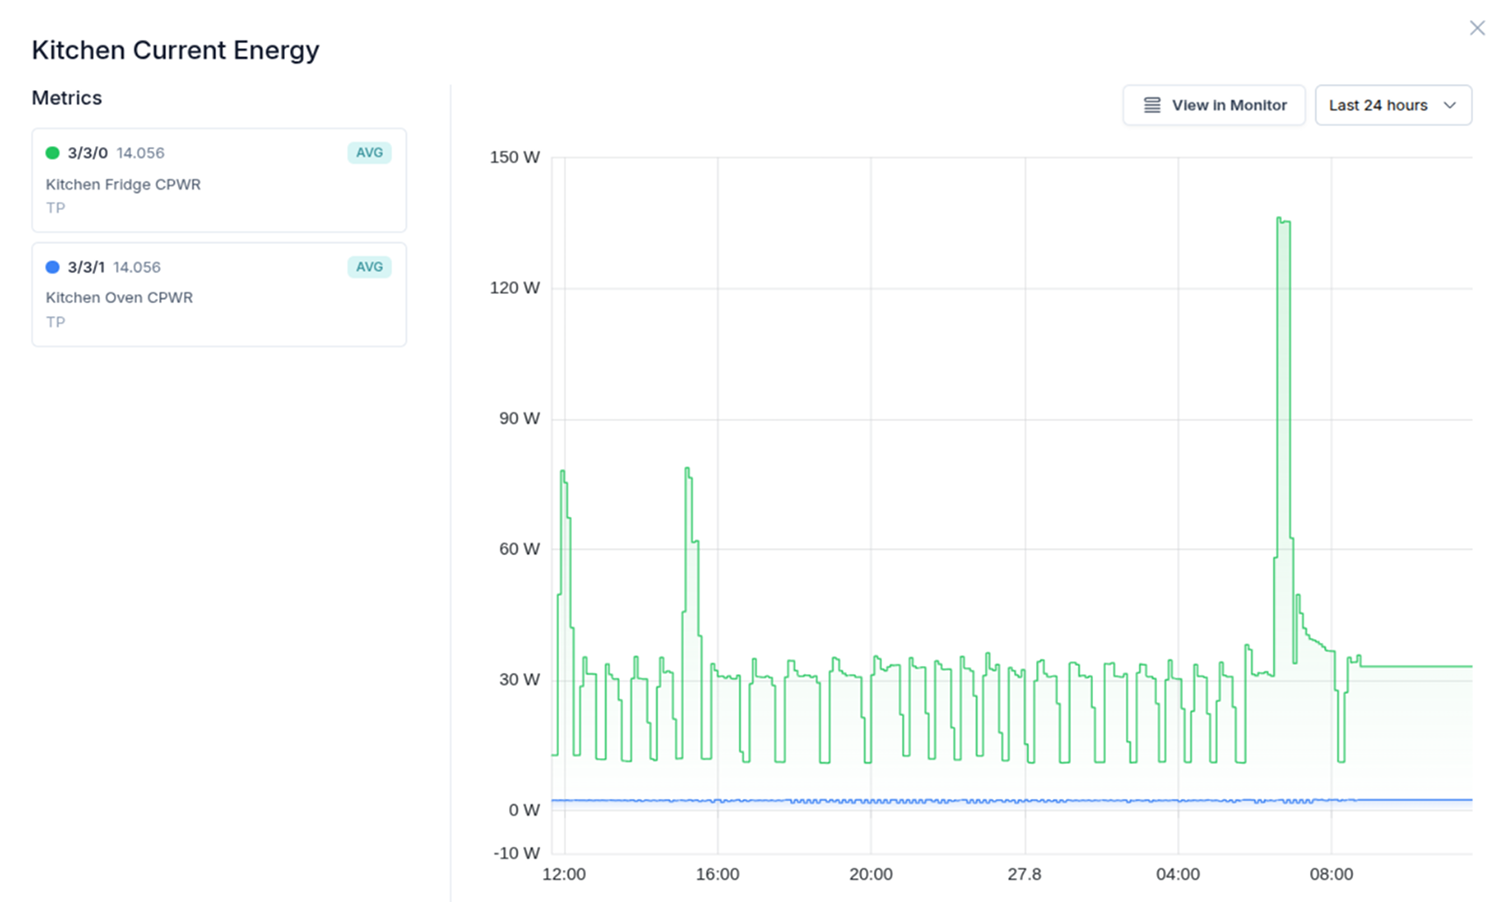
🎬 Video tutorial
Jump directly to the section of the video where we create a custom graph.
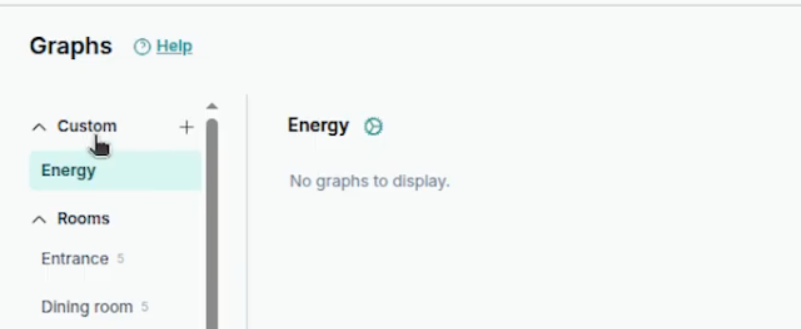
Create custom views
You can create custom views by clicking the + button next to the Custom section.
🎬 Video tutorial
Jump directly to the section of the video where we create a custom view.